Staff

Data Source: Northeastern Banner/Cognos ODS and Colorado Department of Higher Education (CDHE).
NOTE: There will always be slight differences in numbers on this report and various official reporting dates. This is due to data constantly changing and updating daily during the course of the semester and the academic year.
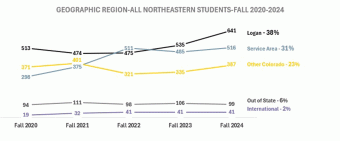
Fall 2024 was comprised of 1,684 students which included 641 students (38%) from Logan County; 516 (31%) from Phillips, Sedgwick, Washington and Yuma Counties; 387 (23%) from 32 counties throughout Colorado; 99 (6%) from 24 states, with Nebraska and Wyoming having the most students attending Northeastern. NJC welcomed 41 (2%) International students from 20 countries around the world, including Australia, Canada, Italy, and Japan.
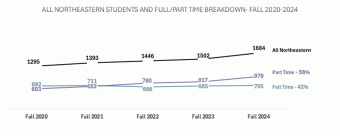
There were 705 (42%) full-time students and 979 (58%) part-time students. The top line in the chart below represents the total number of students attending Northeastern in the past five years.
The percentage of full-time female students was 53% while male students totaled 47%; however, when comparing the number of part time female and male students, the number of male students is significantly less at 27% than females at 73%.
The significant difference in the part time numbers has been a common trend for the past five years; however, this difference has increased over the past three years.
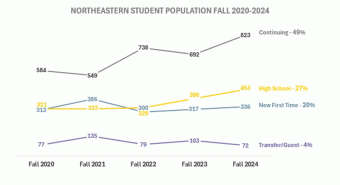
Twenty percent (20%) of Northeastern students were new first time, while 27% were high school students (also known as high school concurrent). Four percent (4%) of students transferred in from another college and the remaining 49% were continuing. The continuing population is somewhat inflated as teachers completing re-certification courses are becoming a larger number than in the past.
Seventy-one percent (71%) of students at Northeastern were age 29 and under; this group is known as Generation Z. This compares to 72% for Fall 2023 and 71% for Fall 2022.
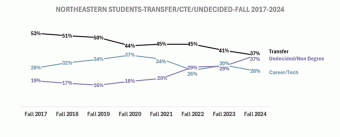
Thirty-seven percent (37%) of Northeastern students are working toward Associate of Arts, Associate of Science, and Associate of General Studies degrees while 15% are working toward Applied Science degrees. Eleven percent (11%) are working toward certificates in a variety of subjects.
The following chart summarizes the percentage of students who are working toward transfer out degrees (Associate of Arts, Science, and General Studies), and the percentage who are working toward Career/Technical degrees. From Fall 2017 to Fall 2020, transfer out programs had been decreasing and career/tech programs had been increasing. For Fall 2021 and 2022, the reverse happened. Fall 2023 it appears that transfer again decreased while career tech increased. Fall 2024 shows decreases in both. The number of Non-Degree Seeking and Undecided has increased to 37%. The rise over the past several years of Non-Degree Seeking and Undecided percentage is mostly the result of an increasing population of high school concurrent students along with teachers attending re-certification courses. High School Concurrent students are often listed as undecided; and teachers are listed as non-degree seeking. The chart below has been extended to eight years in order to see the changes of these groups over time.
When looking at race/ethnicity of all students at Northeastern, White non-Hispanic students account for the largest category with 72% while Students of Color account for 21%. When looking at full time students only, White non-Hispanic students account for 62% of the student population while Students of Color account for 29%. For Students of Color this compares to 28% for the previous two years.
Of the 1,684 Northeastern students, 46% have identified themselves as first generation. This compares to 46% for the previous two years
Sixty-seven percent (67%) of those are female students.
Northeastern welcomed 336 new first-time students in Fall 2024, 90% of these students attended full time. Of the full-time students, 53% were male, 46% were first generation, 43% were PELL eligible, and 27% were Students of Color. Geographically, 23% were from Logan County, 14% were from the remaining service area, 45% were from other parts of Colorado, 11% were from out of state, and 7% were International students.
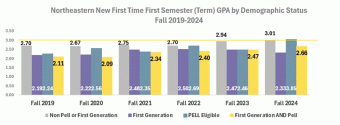
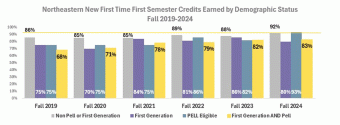
When looking at success measures for new first-time, full-time students at Northeastern, it has been found that students who are both first generation and PELL eligible tend to fall behind their peers in first semester GPA and the percentage of credits earned.
The first chart below shows the average first semester (term) GPA of all new first-time, full-time students by demographic status. Students who are non-first generation/non-PELL eligible are succeeding at higher rates. The yellow line represents the average term GPA of non-first generation/non-PELL eligible students in Fall 2024 to show the contrast between the rates of success. Students who were both first generation and PELL eligible had an average term GPA of just 2.66 while non-first generation/non-PELL eligible students had a term GPA of 3.01.
The same is true when looking at the percentage of credits earned. For Fall 2024, non-first generation/non-PELL eligible students earned 92% of the credits they attempted while students who were both first generation and PELL eligible earned just 83%.
When comparing Fall 2024 to the three previous Fall semesters, for students who are both first generation and PELL eligible, gains have been made. However, the gains are mostly due to the number of Students of Color decreasing and the number of White non-Hispanic students increasing within this specific group.
NOTE: Fall 2019 data has been left in these two charts to show changes from before the pandemic
For the academic year 2023-2024, Northeastern provided college coursework to 473 high school students from 29 school districts. These students attempted 5,321 credits.
The chart below shows the percentage of Northeastern high school concurrent students who became new first-time students after graduation. Nearly thirty-four percent (34%) became new first-time students which compares to 25% in Fall 2023 and 23% in Fall 2022.
Fleming and Sterling/Caliche had the highest percentage of high school concurrent students who become new first-time students at Northeastern after high school graduation, while Peetz and Holyoke also had larger percentages of high school concurrent students attending than in the previous year.
A list of the high school seniors that did not attend Northeastern was sent to National Student Clearinghouse where it was found that 51% entered 4-year colleges, 14% entered 2-year colleges, and the remaining 35% did not have any college enrollment data. Less common majors listed for this group include Aviation, Graphic Design, and Political Science.
For Fall 2024, there were 453 high school/less than high school students attending Northeastern. The majority were part time students; however, 22% were full time students. This compares to 16% for Fall 2023 and 9% for Fall 2022. Sixty-two percent (62%) were female, 25% were Students of Color, 38% were from Logan County, 42% were from the service area and 18% were from other parts of Colorado. Forty-one percent (41%) were first generation.
This group of students earned 96% of the 3,452 credits attempted which compares with 93% for Fall 2023.
The average term GPA for Fall 2024 for high school students was 3.15, while the average cumulative GPA was 3.27. This compares to term GPA of 3.17 and cumulative GPA of 3.28 for Fall 2023.
Overall enrollment of new first-time students increased by 6%. The number of high school concurrent students continues to increase along with the number of school districts served. The number of Hispanic students continues to increase, pushing Northeastern closer to Hispanic Serving Institution status.
Northeastern celebrates the successes of increased enrollment including high school concurrent students, while continuing to face challenges in a number of areas such as decreasing numbers of male students and advancing equity for students who are first generation and Pell eligible. Northeastern moves into the future facing successes as well as challenges in providing a high quality education for all.
