Staff

This data is not easy to obtain because of the privacy surrounding worker’s salaries. At the present time, the only way to obtain this data is using the datasets from the Colorado Department of Higher Education (CDHE) Return on Investment (ROI) Report which is published yearly.
The methodology is complex for this reporting, it is important to remember that Northeastern, is not allowed access to the social security number (tax ID) for worker’s, so the reporting is done through the program that the student graduated from.
Details about this methodology:
CDHE obtains data from the Colorado Department of Labor to match Colorado college graduates who paid in-state tuition and who are still living and working within the state.
The data does not include graduates who have moved out of Colorado and work in another state, those who live and work in Colorado who are self-employed, and those who live and work in Colorado but work for the Federal Government.
The datasets only cover those who are employed full-time.
The Northeastern data does not include any NJC graduate who then transferred into a 4-year college (in state) and graduated; in this case, the former NJC graduate would then only be included in the 4-year college data and not within the Northeastern data.
The Northeastern data could include those who have earned a 4-year degree from another state and the moved back to Colorado to work or could include those who have earned a 4-year degree or higher prior to 2002 which is when the CDHE datasets begin.
The following information has been excerpted from the Northeastern Return on Investment (ROI) Report completed in December 2023.
The full report can be requested from Institutional Research.
According to the 2022 Talent Pipeline Report, Colorado Workforce Development Council (December 2022), 91% of all Tier One Top Jobs will require a post-secondary credential with nearly 77% requiring a Bachelor’s degree; and for Tier Two Top Jobs, 70% will require some type of credential earned after completing high school.
Tier One and Two Top Jobs are defined as:
NOTE: Only 11.5% of Tier One and 19.4% of Tier Two Top Jobs required an associate degree or less education McKennie and Glydych (2023).
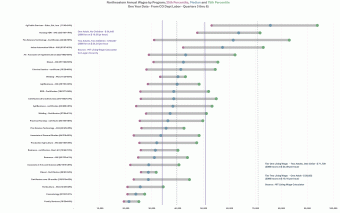
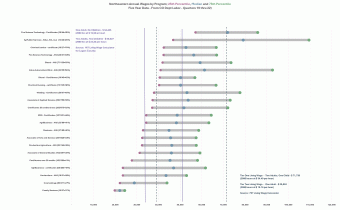
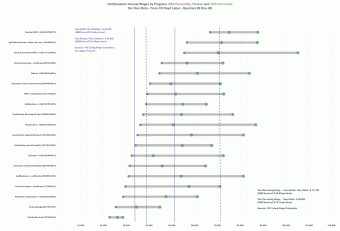
The MIT Living Wage Calculator (Glasmeier, 2023) for Colorado has been used to determine what constitutes a living wage. This calculator has determined that for one person, with no children, earning a wage of $ 39,852 ($ 19.16 per hour) will provide enough income to pay living expenses adequately which is considered a Tier Two wage; and $ 71,739 ($ 34.49 per hour) will provide enough income for two persons (one working) and one child which is considered Tier One wage. Additionally, the MIT Living Wage Calculator-Logan County Glasmeier (2023) has determined that for one person with no children, a wage of $ 34,445 ($ 16.56 per hour) will provide enough income to pay living expenses and $ 50,627 ($ 24.34 per hour) is sufficient to pay expenses for two persons (both working) and two children. These figures are based on 2080 hours of work per year which is considered full time.
Percentiles are used as a comparison of all earnings within the data. If earnings are in the 75th percentile, those earnings are higher than 75% of all other earnings, while earnings that are in the 25th percentile are higher that 25% of all other earnings. The median is where half of all earnings are lower, and half higher.
Earnings for the charts are divided into the programs graduates received their award from and next to each program listed is the percentage of graduates found for the reported earnings compared to the number who actually graduated.
When looking at the three charts, the 25th percentile earnings are in pink, the median earnings are in blue, and the 75th percentile earnings are in green. The plum vertical lines and explanation box represents Tier One and Two living wage amounts for Logan County while the dark blue dotted vertical lines and explanation box represent the statewide Tier One and Two living wage amounts. Since we don’t know where our graduates choose to reside within Colorado, it is important to keep the statewide earnings (dark blue) on the chart for reference. Each chart is arranged so that the programs with the highest earnings are at the top and lowest earnings are at the bottom.


CDHE has developed the Post-Secondary Degree Earnings Outcome Tools in order to assist all who are interested in finding median earnings for various programs, colleges, and degree levels for a one, five, and 10 year period. The tool is set up to find earnings data for all public colleges within Colorado as well as a few well-known private colleges and users are also able to find earnings data by gender and ethnicity.
The data set used for this tool is the same dataset used to create the Northeastern ROI report.
In addition to earnings data received from the Colorado Department of Higher Education, the U.S. Census Bureau has the Post-Secondary Outcomes Explorer (PSEO) PSEO Explorer Tool where earnings for programs of study can be found for Northeastern graduates. This tool can also be used to see out flows of graduates who now reside in other states. Keep in mind that this data does have more limitations than the CDHE earnings data in that 1) programs are grouped into larger and fewer buckets, 2) not all 50 states have released all earnings data to be used within this tool, and 3) the out flows show the region where a graduate may now live, but does not include the earnings if using this view.
PSEO Explorer shows a map of the states participating, and Methodology goes over what is and is not included within this data.
Like the CDHE earnings reporting, this Census data only follows graduates who have completed a program and are working full time. Earnings data are set up into the 25th, 50th and 75th percentiles and follows a one, five, and 10 year earnings cycle.
There are some slight differences in the cohort of workers, an example is that CDHE data begins in 2002, while Census data begins in 2001. Census data is also slightly different in the groups of workers not included within the data. Graduates who are independent contractors, self-employed, railroad workers covered under separate unemployment insurance, some farm workers, some employees of family-owned businesses, some non-profit workers, and salespeople paid entirely on commission are not included in this data.
Even with the limitations, this is a valuable tool that can provide another way to find earnings data and will continue to evolve into a more informative and usable tool.
References
Colorado Workforce Development Council, 2022. 2022 Talent Pipeline Report.
Glasmeier, Amy K., Living Wage Calculator. 2023. Massachusetts Institute of Technology. https://livingwage.mit.edu.
McKennie, Caitlin Dr., Gladych, Stan, 2023. Higher Education Return on Investment Report.
U.S. Census Bureau, 2023. Post-Secondary Employment Outcomes Explorer https://lehd.ces.census.gov/
